March 27, 2025

Product Release Summary

Buxton’s team has been working hard to enhance your platform experience. We are excited to share these updates with you.

UI Improvements for Personas+

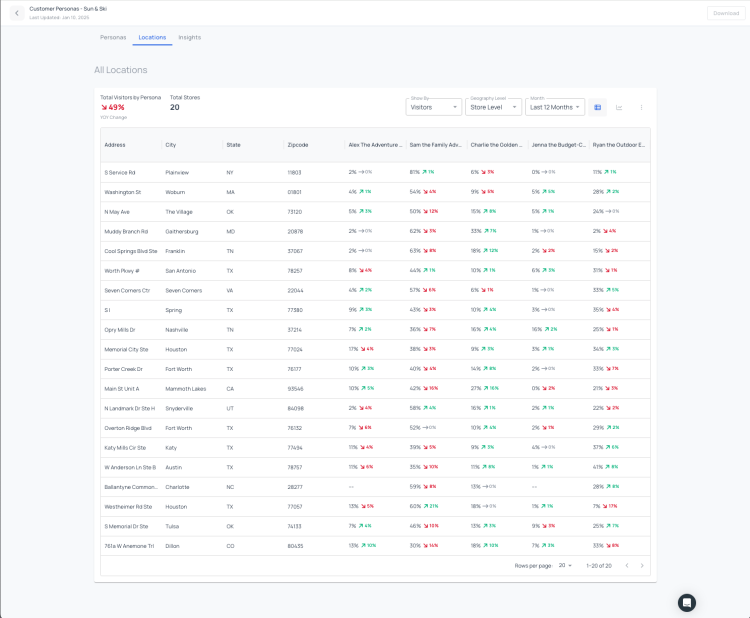
We’ve made a few user interface updates to the Personas+ application to make it easier to find what you need.

Particularly noteworthy? Location metrics and other metrics are now separated into two distinct tabs.

UI Improvements for Personas+

New Datasets Now Available in Configurable Reporting

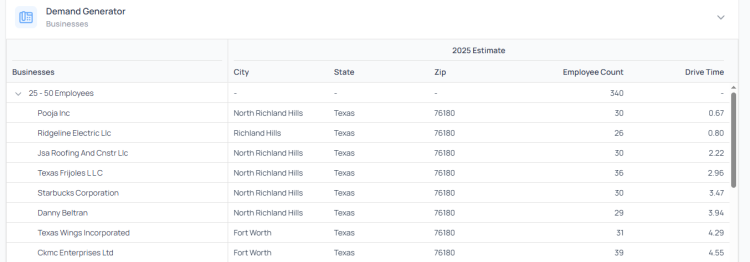
We’re continuing to expand the popular configurable reporting feature. Datasets from our Demand Generator report are now available in the configurable reporting interface. The best part? All SCOUT subscribers – regardless of whether you had previous access to our Demand Generator report – can now use these datasets! 

So what kinds of insights can you now access? You'll find datasets to help you better understand the business landscape in a geography, which is helpful for sharpening your understanding of daytime population, identifying potential area draw factors, or even identifying potential B2B customers. 

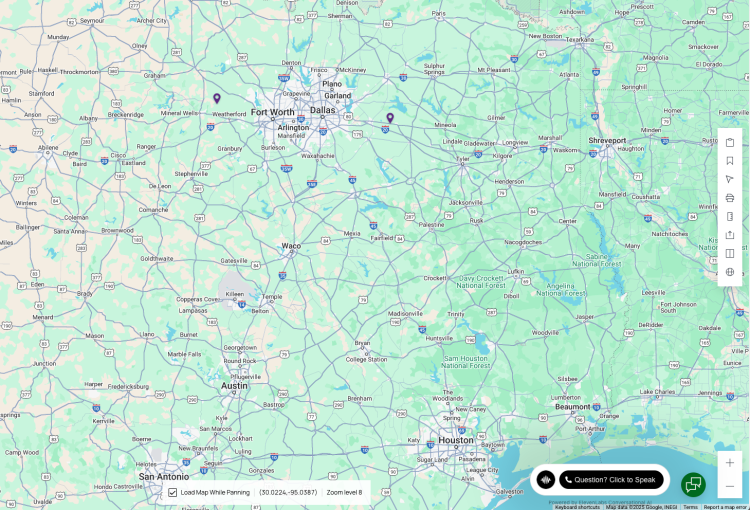
For example, you can generate a named list of businesses with employee counts for different tiers (example: 25-50 employees). Additionally, you can generate a named list of locations, along with their distance from the center of your study area, for the following categories: 

  • Amusement parks
  • Casinos
  • Convention centers
  • Education
  • Federal government facilities
  • Golf courses
  • Hospitals
  • Military bases
  • Nearby airports
  • Ports
  • Prisons
  • Research parks
  • Shopping centers
  • Stadiums and arenas
  • State government facilities
  • Train stations
  • Nearby lakes

For more information about configurable reporting and tutorial videos, visit our resource page.

New Datasets Now Available in Configurable Reporting

Early Access to New Voice Assistant Technology

Notice something new in SCOUT? The new black voice icon gives you access to voice assistant technology that we’re piloting. Right now, it can be used for quick answers to questions about how to use SCOUT, such as “how do I edit an existing territory without starting from scratch?” or “what are the benchmark locations used for in my healthcare site score report?”

We have big plans for this feature, so stay tuned for the full launch! In the meantime, if you give it a try and have feedback for us, shoot us a note at clients@buxtonco.com.

Early Access to New Voice Assistant Technology

Have more questions?

Have more questions about these applications? Check out the Knowledge Base or contact our support teams. 

Release Notes: SCOUT Report Migrations
SCOUT Report Migrations

Product Release Summary

We're bringing the customization options you love to all standard SCOUT reports through our new configurable reporting interface. Get the answers and resources you need to be ready for the upcoming migrations. 

Customize standard SCOUT reports with simple checkbox menus and drag-and-drop reordering

We're migrating all standard U.S. SCOUT reports to our latest configurable reporting interface, giving you the freedom to mix-and-match variables to create your own unique combinations.

The migration is happening on a rolling schedule. We'll notify you after each change so you’ll always know where to find the data you need.

Need a quick refresh on the configurable reporting interface? Check out our tutorial video

Customize standard SCOUT reports with simple checkbox menus and drag-and-drop reordering

Save multiple combinations of report settings as templates for quick and easy reporting

You can save multiple combinations of report settings to make it a breeze to pull the exact report you want, whenever you want it.

Watch our tutorial video to learn how to create, save, and edit your configurations.

Save multiple combinations of report settings as templates for quick and easy reporting

Other FAQs

When will I receive the new configurable reporting features?

All SCOUT users with reporting permissions will receive these new reporting features on a rolling schedule. The migration process started on December 12, 2024, and is expected to be completed by the end of Q1 2025.

Buxton will notify you about the specific reports being migrated after each migration occurs so you will always know where to find the data you need. To make the transition process easier, we will leave the legacy reports active for a few weeks following each migration so you have time to set up the new reporting interface the way you prefer. 


Which SCOUT reports are being migrated?

The reports that come standard with each SCOUT edition as well as the reports that are part of the SCOUT Healthcare Data Package will ultimately be migrated to the new reporting interface. Standard reports include reports such as the media preferences report, business summary report, core households report, and more. Custom reports that Buxton developed specifically for your organization will not be migrated at this time.


With multiple reports rolling into the configurable reporting interface, how do I quickly see different types of reports?

Just like before, you have the option to save preferred report settings as “saved configurations.” You can have multiple combinations of configurations, or templates, which means any future report you run based on that template will use the same settings. This gives you the flexibility to either run a specific report or start from scratch and mix-and-match your variables.

As a reminder, your template settings are unique to you and are not shared across your organization’s account.


Will Buxton "pre-save" the report templates to replicate legacy SCOUT reports (e.g. the profiles report)? 

No, as legacy SCOUT reports migrate into the configurable reporting interface, the datasets will move over but the report settings (templates) will not. If you are a fan of one of our legacy report templates, you can re-create it by customizing your report settings and saving it as one of your saved configurations (e.g. "My Profiles Report"). Otherwise, you can mix and match datasets to create your own unique report template that meets your team's needs. 

To make the transition process easier, we will leave the legacy reports active for a few weeks following each migration so you have time to set up the new reporting interface the way you prefer.


With multiple reports rolling into the configurable reporting interface, how does the process of running a report work?

1. Select your geography and click “Configurable Report” to run a report.

2. You will be given the option to either select a template you previously saved or start from scratch.

3. If you select a template, you will see the variables associated with that template in the format that you previously set. You can click the “Customize” button to make further changes.

4. If you start from scratch, select "Start with an Empty Report" from the drop-down list, click "Submit," then click to view your report from the results tab. With your empty report open, click "Add Report Data" to select the variables you want to include in your new report and adjust the order they are shown. You can preview the changes by clicking "Update."

5. You have the option to save preferred report settings as “saved configurations” or templates. You may save an unlimited number of templates. To do this, go to the Customize menu and click the "Save As" button. To save as a new template, click "Update Report and Create New Configuration." 


How do I customize what I want to see in the report? 

After running your report, click the “Customize” button to control which variables are displayed and the order they are shown.


Do all users have access to all data variables included in the report migrations? 

SCOUT users with reporting permissions will have access to all data variables in configurable reporting, with a couple of exceptions. 

Some variables are dependent on other subscriptions. For example, if your SCOUT application does not currently have a customer profile loaded, then you will not be able to report on customer profiles in the new reporting interface. Certain healthcare datasets are dependent upon purchasing the SCOUT Healthcare Data Package and therefore won't be available to all users. 


Are all configurable reports available as comparison reports?

Yes, all configurable reports may be run on either a single geography or up to five geographies for comparison reporting purposes.


What will happen to the existing standard reports that are being migrated?

We are replacing the old standard reporting feature with the new configurable reporting feature.

Once we migrate a standard report to the configurable reporting interface, you will have access to the legacy report for an additional three weeks. At that point, we will retire the legacy report and you will no longer be able to run that report in the old interface. Any standard reports you previously ran will be retained in your report history in their original format.


What are the user interface enhancements included in the February 13 release?

1. Added a new chapter panel on the left side of the Report screen so you can easily jump to different sections of your report

2. Added new icons for each category in the Report so you can visually tell the difference between sections

3. Enhanced the search functionality in the Customize drawer to make it faster to find the variables you want to include

4. Improved the drag-and-drop functionality in the Customize drawer to make it faster to re-arrange the report layout

5. Upgraded in-line editing for the report title to make it faster to change your report title on the fly

Have more questions?

Have more questions about these updates? You can contact Buxton’s customer success team via in-platform chat or email.

Release Notes: SCOUT Report Migrations and New Templating Feature
SCOUT Report Migrations and New Templating Feature

Product Release Summary

After launching our new configurable reporting interface with U.S. demographics reports earlier this year, we’re now bringing the customization options you love to even more SCOUT reports. Get the answers and resources you need to be ready for the upcoming migrations. 

Customize standard SCOUT reports with simple checkbox menus and drag-and-drop reordering

Beginning in December 2024, we’re kicking off the process of migrating all standard U.S. SCOUT reports to our latest configurable reporting interface, giving you the freedom to mix-and-match variables to create your own unique combinations.

The migration will happen on a rolling schedule. We’ll give you a heads-up prior to each change so you’ll always know where to find the data you need.

NEW feature coming soon: As part of an upcoming release, we’re updating the report building sequence to make it faster to build a report from scratch. Rather than viewing all variables by default and then editing the report to remove the ones you don’t need, you will start with an empty report and then add the fields you want to include. You can save your new report configuration to access it again and edit it at any time. A release date for this change will be communicated soon.

Need a quick refresh on the configurable reporting interface? Check out our tutorial video

Customize standard SCOUT reports with simple checkbox menus and drag-and-drop reordering

Save multiple combinations of report settings as templates for quick and easy reporting

We’re also introducing a new templating feature for configurable reports. With this new feature, you can save multiple combinations of report settings to make it a breeze to pull the exact report you want, whenever you want it.

Watch our tutorial video to learn how to create, save, and edit your configurations.

Save multiple combinations of report settings as templates for quick and easy reporting

Other FAQs

Is this the same interface that is used in demographics reports?

Yes, the demographics report was the first SCOUT report to move to the new configurable reporting interface. We are now beginning the process of moving additional reports to this interface.


When will I receive the new configurable reporting features?

All SCOUT users with reporting permissions will receive these new reporting features on a rolling schedule beginning with our platform release the evening of December 12, 2024. All report migrations are expected to be completed by the end of Q1 2025.

Buxton will notify you about the specific reports being migrated before each migration occurs so you will always know where to find the data you need.


Which SCOUT reports are being migrated?

The reports that come standard with each SCOUT edition as well as the reports that are part of the SCOUT Healthcare Data Package will ultimately be migrated to the new reporting interface. Standard reports include reports such as the media preferences report, business summary report, core households report, and more. Custom reports that Buxton developed specifically for your organization will not be migrated at this time.


With multiple reports rolling into the configurable reporting interface, how do I quickly see different types of reports?

Just like before, you have the option to save preferred report settings as “saved configurations.” You can now have multiple combinations of configurations, or templates, which means any future report you run based on that template will use the same settings. This gives you the flexibility to either run a specific report or start from scratch and mix-and-match your variables.

As a reminder, your template settings are unique to you and are not shared across your organization’s account.


Will Buxton "pre-save" the report templates to replicate legacy SCOUT reports (e.g. the profiles report)? 

No, as legacy SCOUT reports migrate into the configurable reporting interface, the datasets will move over but the report settings (templates) will not. If you are a fan of one of our legacy report templates, you can re-create it by customizing your report settings and saving it as one of your saved configurations (e.g. "My Profiles Report"). Otherwise, you can mix and match datasets to create your own unique report template that meets your team's needs. 


With multiple reports rolling into the configurable reporting interface, how does the process of running a report work?

1. Select your geography and click “Configurable Report” to run a report.

2. You will be given the option to either select a template you previously saved or start from scratch.

3. If you select a template, you will see the variables associated with that template in the format that you previously set. You can click the “Customize” button to make further changes.

4. If you start from scratch, run the report and view the results. Click the “Customize” button to control which variables are displayed and the order they are shown. After the launch of our new "build from scratch" reporting option (release date to be announced), you will select the option “Start with an Empty Report.” When you view the report, you will see a blank page with a prompt to select the variables you want to include and the order they are shown.

5. You have the option to save preferred report settings as “saved configurations” or templates. You may save an unlimited number of templates.


How do I customize what I want to see in the report? 

After running your report, click the “Customize” button to control which variables are displayed and the order they are shown.


Do all users have access to all data variables included in the report migrations? 

SCOUT users with reporting permissions will have access to the same data variables that they had previously.

Some variables are dependent on other subscriptions. For example, if your SCOUT application does not currently have a customer profile loaded and therefore didn’t have the legacy core households report, then you will not be able to report on customer profiles in the new reporting interface either once that migration occurs.


If I previously saved default selections for a configurable demographics report, will those be preserved?

If you saved default selections for a demographics report prior to December 13, 2024, you need to re-save that configuration after that date using our new templating feature to apply to future reports. This is a one-time change that we do not anticipate will impact future report migrations.

Any demographics reports you ran prior to December 13, 2024, using your old default selections will remain unchanged.


Are all configurable reports available as comparison reports?

Yes, all configurable reports may be run on either a single geography or up to five geographies for comparison reporting purposes.


What will happen to the existing standard reports that are being migrated?

We are replacing the old standard reporting feature with the new configurable reporting feature. Once we complete the migration of a standard report to the configurable reporting interface, you will no longer be able to run that report in the old interface. Any standard reports you previously ran will be retained in your report history in their original format.

Have more questions?

Have more questions about these updates? You can contact Buxton’s customer success team via in-platform chat or email.

Release Notes: Healthcare Expenditure Thematics
Healthcare Expenditure Thematics

Product Release Summary

Your SCOUT mapping options are even richer with the debut of our new healthcare expenditure thematics. Keep reading to find out more. 

New Healthcare Expenditure Thematics

Know at a glance which areas of a market tend to spend more on wellness related products and services.

Buxton’s new healthcare expenditure thematics help you visualize spending levels by block group or ZIP code for 23 categories. Use these as a proxy for demand to further confirm location decisions, optimize geographic targeting for marketing campaigns, prioritize M&A targets, and more.

The best part? The new thematics are available to all SCOUT subscribers. 

New Healthcare Expenditure Thematics

Available Healthcare Expenditure Thematics

Our new thematics options include the following: 

  • Blue Cross, Blue Shield 
  • Care in Convalescent or Nursing Home 
  • Children's Health Insurance Program (CHIP) Premiums 
  • Commercial Health Insurance 
  • Commercial Medicare Supplements and Other Health Insurance 
  • Dental Services 
  • Eyecare Services 
  • Eyeglasses and Contact Lenses 
  • Health Maintenance Organization (not BCBS) 
  • Hearing Aids 
  • Hospital Room and Services 
  • Lab Tests, X-Rays 
  • Long Term Care Insurance 
  • Medicaid Premiums 
  • Medicare Payments 
  • Medicare Prescription Drug Premium 
  • Other Medical Care Services 
  • Pet Purchase, Supplies, Medicine 
  • Pet Services 
  • Physician's Services 
  • Service by Professionals Other Than Physician 
  • Tricare Military Premiums 
  • Vet Services 

How to Access the New Thematics

To access the new thematics, click the Thematics tab in the left menu of SCOUT. Select between ZIP code level or block group level thematics. 

How to Access the New Thematics

Have more questions?

Have more questions about this feature? Contact the customer support team.

Release Notes: October 30, 2024
October 30, 2024

Product Release Summary

Buxton’s team has been working hard to enhance your platform experience. We are excited to share these updates with you.

Reorder and Rename Columns in Comparison Version of Configurable Demographics Reports

Simplify interpretation of comparison reports.

The comparison version of SCOUT’s configurable demographic reports now gives you the ability to reorder and rename columns in your report results. You can use this feature with any new or previously run configurable comparison reports. Simplify default naming conventions and show relevant columns next to each other for faster interpretation.


How to Use: 

From the results view for a configurable comparison report, click Customize Report and then Table Settings.

In the Column Details section, click the pencil icon to the right of each line item to retitle the column.

Click the left side of the line item to drag and reorder the columns.

Reorder and Rename Columns in Comparison Version of Configurable Demographics Reports

Ensure a Smoother Geocoding Experience with New Import Limits

Ensure your My Data uploads happen without a hitch by following our new import guidelines.

For any point-based files that require geocoding, SCOUT now caps the import at 5,000 records per file. Need to upload more than 5,000 records? Split your file into batches of 5,000 or less to ensure a smooth geocoding experience.

Have more questions?

Have more questions about these applications? Check out the Knowledge Base or contact the customer success team.

Release Notes: October 10, 2024
October 10, 2024

Product Release Summary

Buxton’s team has been working hard to enhance your platform experience. We are excited to share these updates with you.

Compare Multiple Geographies in Configurable Demographics Reports

SCOUT’s configurable demographic reports now feature a popular time-saving feature: geography comparisons.

Instead of running separate demographic reports for different geographies, you can now add up to five geographies to a single report for quick and easy comparisons.

Show potential franchisees how the territories they are evaluating compare to each other, illustrate demographic differences in current trade areas for your executive team, or validate how similar two markets are before launching an ad campaign.


How to Use: 

To use the comparison feature, start by adding up to five custom or standard geographies to your study area, confirm that you want to run a report on the study area, then follow the normal process for running a report. Select the option to compare the geographies in a single report.

Watch our tutorial video for a quick overview of the process. 

Compare Multiple Geographies in Configurable Demographics Reports

Customize the Census Datasets in Configurable Demographics Reports

Focus your reports on the data that matters most to you.

SCOUT’s configurable demographic reports now give you the ability customize which Census dataset is used in the report. Instead of viewing all datasets and wading through data you don’t need, you can select a single dataset to quickly narrow your view.


How to Use: 

From the results view for either a single geography or multi-geography report, click Customize Report and then Table Settings to select the Census data used in the report.

Options include 2020 Census, 2023 Census, 2028 Projections, 2020-2023%, or 2023-2028%.

Customize the Census Datasets in Configurable Demographics Reports

Have more questions?

Have more questions about these applications? Check out the Knowledge Base or contact the customer success team.

Release Notes: August 29, 2024
August 29, 2024

Product Release Summary

Buxton’s team has been working hard to enhance your platform experience. We are excited to share these updates with you.

Upload KML or KMZ Files

If your team uses another geospatial system that exports data as KML or KMZ files, it is now a breeze to import that data into SCOUT to see everything in one place.

SCOUT geography uploads for territories, areas of interest, and results now accept KML and KMZ files.

Configure Your Demographics Reports

Get ready for a better way to run demographics reports in SCOUT. Our new reporting interface gives you control over which fields are displayed and how they are displayed so you can create the demographics report that meets your needs.

All current standard SCOUT U.S. demographics report options have been replaced by one new configurable demographics report. Any standard demographics reports you previously ran will be retained in your report history in their original format. Additionally, you will retain access to any custom demographic reporting features that Buxton created for your organization.

Want to learn more about the configurable demographics report? Check out our expanded release notes and FAQs. 

Configure Your Demographics Reports

Enjoy an Updated Explore Window

The SCOUT Explore window received some TLC in this release. These changes are designed to give you a more consistent experience throughout the application.

We clarified terminology by changing “median household value” to “median housing value,” updated the order of the fields on the Potential tab to mirror the order you see elsewhere in the application, updated the datasets for Mobilytics Places and switched from an estimated value to an observed value, and made some methodology adjustments to our value calculations for greater consistency with other areas of the application.

Have more questions?

Have more questions about these applications? Check out the Knowledge Base or contact the customer success team.

Release Notes: Configurable Reporting: SCOUT Demographics Reports
Configurable Reporting: SCOUT Demographics Reports

Product Release Summary

Get ready for a better way to run demographics reports in SCOUT. Our new reporting interface gives you control over which fields are displayed and how they are displayed so you can create the demographics report that meets your needs.

All current SCOUT U.S. demographics report options will be replaced with one new configurable demographics report as part of the platform release on August 29, 2024.

Control the variables displayed in your demographics report with simple checkbox menus.

With our new configurable reporting interface, you are in control of which variables appear in your final report. After running your demographics report, click the “Customize” button to control which variables are displayed and which variables are excluded from your final output. 

Control the variables displayed in your demographics report with simple checkbox menus.

Drag and drop sections to update the order of the information shown.

Make it easy for your team to see what matters most. Click the "Customize" button and then drag and drop sections to optimize the order of the information for your team's needs. 

Drag and drop sections to update the order of the information shown.

Save your preferred report settings to save time when running future reports.

Created your perfect report template? Save it to make it faster to run in the future! Your preferred report settings can be saved as “default selectors,” which means that all subsequent demographics reports will use those settings. A helpful note: these settings are unique to you and are not shared across your organization’s SCOUT account.

Save your preferred report settings to save time when running future reports.

Other FAQs

When will I receive the new configurable demographics report feature? All SCOUT users with reporting permissions will receive this new reporting feature as part of our platform release the evening of August 29.

Does the new configurable report reflect all the variables previously included in all old demographics reports? Yes, all variables in the current suite of U.S. demographics reports will be offered in the new configurable demographics report. Please note that some visualizations included in the current reports, such as charts, are not supported in the configurable report at this time.

How do I share the new configurable report? After running a configurable report, you can export your findings as a .CSV or PDF file.

One of the current demographic report options allows users to compare multiple study areas. Will this option be offered in the new configurable demographic report?
The initial version of configurable reporting does not offer the ability to compare multiple geographies in a single report. This feature will be coming soon; contact your Buxton representative if you need additional support. An alternative is to combine the .CSV outputs of multiple reports to make comparisons.

What will happen to the existing standard demographics reports and custom demographics reports? We are replacing the old standard U.S. demographics reporting feature with the new configurable demographics reporting feature. Any standard demographics reports you previously ran will be retained in your report history in their original format. Additionally, you will retain access to any custom demographic reporting features that Buxton created for your organization.

For users with international reporting, will this option be available?
No, this release is only applicable to the U.S. demographic reports.

Have more questions?

Have more questions about this feature? Contact the customer success team.

Release Notes: April 4, 2024
April 4, 2024

Product Release Summary

Buxton’s team has been working hard to enhance your platform experience. We are excited to share these updates with you.

Share Bookmarks for Easy Collaboration

Created a killer SCOUT map view that you want others in your organization to see? SCOUT bookmarks are now shareable!   

Set the access permissions to “entire organization” when creating a new bookmark to let other users in your account see your great work. 

Just a note – this feature applies to new bookmarks, not legacy bookmarks.

Share Bookmarks for Easy Collaboration

Browse Bookmarks

You can now browse the newly re-organized Bookmarks tab to see your bookmarks and any bookmarks that have been shared with you.

Browse Bookmarks

SCOUT Hospitality Edition Updates: New Search Options

Find the properties and groups you are looking for faster with the new search box in the Hotels menu. Just start typing what you are trying to find for quicker filtering.

SCOUT Hospitality Edition Updates: New Search Options

SCOUT Hospitality Edition Updates: Activate All Layers With One Click

If you want to turn on all your open or pipeline grouped hotel layers, you can now do so with a single click. Click Hotels, select the Groups tab, then click the check box for All Open/Pipeline Groups.

SCOUT Hospitality Edition Updates: Activate All Layers With One Click

Have more questions?

Have more questions about these applications? Check out the Knowledge Base or contact the customer success team.

Release Notes: March 14, 2024
March 14, 2024

Product Release Summary

Buxton’s team has been working hard to enhance your platform experience. We are excited to share some important data updates with you.

2023 Data Update

IQ received an important data update in this release, as we transitioned to the latest available information for popular data fields. 

2023 U.S. demographic, psychographic, geographic, and drive-time data is now reflected in the application. Happy query building! 

2023 Data Update

Data Expansion

We’re committed to bringing you the best possible reporting experience, which is why we have expanded the volume of mobility data that feeds our Match application.

With this expanded dataset, your Match reports will be even more robust. 

Data Expansion

Data Expansion

Mobilytics Advanced Reporting received the same mobility dataset expansion that now feeds our Match application. 

While you may notice that reports take a little longer to run, you’ll be rewarded with more robust answers.

Data Expansion

2023 Data Update: U.S. and Canada

Both the U.S. and Canada editions of SCOUT received data updates in this release. 

SCOUT maps and most standard reports in both countries now reflect 2023 demographic, psychographic, geographic, and drive-time data. Here's the complete list of standard reports that were updated. Please note that report availability varies by industry and SCOUT edition. 

U.S.

    • Actual Customers Report
    • Demographic Reports
    • Core Households Report
    • Consumer Propensity Report
    • Custom Variable Report
    • Daytime Population and Business Report
    • Green Awareness
    • Penetration Report
    • Profile Report
    • Retail Leakage Report
    • Site Similarity Analysis Report


    Canada

    • Canadian Actual Customers Report
    • Canadian Business Report
    • Canadian Demographic Reports
    • Canadian Penetration Report
    • Canadian Profile Report


    Custom reports, including site score reports, will be updated to the new datasets according to your regular refresh schedule. 

    2023 Data Update: U.S. and Canada

    Have more questions?

    Have more questions about these applications? Check out the Knowledge Base or contact the customer success team.

    Release Notes: September 28, 2023
    September 28, 2023

    Product Release Summary

    Buxton’s team has been working hard to enhance your platform experience and we are excited to share some new features with you!

    Check out these product updates.

    Territory Query Updates

    Teamwork makes the dream work.

    Use territories created by your colleagues in SCOUT to build your own Geography queries in IQ. Save time and reduce duplicated efforts to find the answers you need.

    Territory Query Updates

    Mobilytics Potential Customers Mapping

    Some things are just easier to explain using a map. We’ve restored the ability to view potential customers that you identify in Mobilytics on the SCOUT map.

    Location Pushpin Imports

    Importing location pushpins into SCOUT in bulk can be a huge time saver. We’ve updated the way SCOUT handles pesky special characters in Excel files so the process is as smooth as possible.

    Location Pushpin Imports

    Have more questions?

    Have more questions? Check out the Knowledge Base or contact your customer success manager.

    Release Notes: July 6, 2023
    July 6, 2023

    Product Release Summary

    Buxton’s team has been working hard to enhance your platform experience and we are excited to share some new features with you!

    Check out these product updates.

    Location Query Data Appends

    Ever wished you could sort a list of locations based on the volume of potential customers in the area around your locations? Our latest IQ feature makes it easy.

    IQ now allows you to append counts of potential customers who match your Buxton customer profile and are in a specified area around each location to a list of My Locations query results. From there, you can sort the list or add context to discussions about location-level strategies.

    If you have more than one customer profile, you can select which profile(s) to use in the counts. People who are included in multiple profile groups will only be counted once in the total to avoid duplicates.

    Location Query Data Appends

    Bulk Edits

    We’re saving you time as you edit your default Factor model settings. You can now bulk edit competitors and cotenants to refine the list included in your analysis.

    Simply check the boxes next to the brands you wish to remove, or select all, then click delete!

    Bulk Edits

    Have more questions?

    Have more questions? Check out the Knowledge Base or contact your customer success manager. 

    Release Notes: June 15, 2023
    June 15, 2023

    Product Release Summary

    Buxton’s team has been working hard to enhance your platform experience and we are excited to share some new features with you!

    Check out these product updates.

    Social Determinants of Health Report

    We’re making it easier to understand the social factors influencing patient health outcomes in each community you serve, allocate resources, and guide partnership decisions.

    The new Social Determinants of Health Report grades U.S. census tracts for the six major, non-medical factors that influence health outcomes. This report is now available as part of a SCOUT Healthcare Data Package or SCOUT Public Sector edition subscription.

    Social Determinants of Health Report

    Optimizer

    Increase your confidence in strategic planning by evaluating not one, but multiple expansion plan options.

    The new Optimizer from Buxton gives you instant access to market optimization scenarios so you can pick the right path for your organization.

    Optimizer is now available as a subscription enhancement. Learn more about it then talk to your account representative about adding it to your subscription.

    Optimizer

    Pushpin Queries

    Ever wished you could filter a list of addresses other than your own locations? Now you can!

    IQ now supports queries on pushpins created in SCOUT through the My Locations query builder. Evaluate potential real estate and so much more.

    Pushpin Queries

    Have more questions?

    Have more questions? Check out the Knowledge Base or contact your customer success manager. 

    Release Notes: April 27, 2023
    April 27, 2023

    Product Release Summary

    Buxton’s team has been working hard to enhance your platform experience and we are excited to share some new features with you!

    Check out these product updates.

    Print and share map thematics

    Discovered a fascinating insight using SCOUT thematics? Illustrate it for your colleagues by including that thematic in your print or share views.

    SCOUT now supports printing and sharing all current map thematics, including healthcare thematics, commercial traffic thematics, and vehicle registration thematics.

    Print and share map thematics

    Filter locations with custom fields

    Find what you are looking for faster! We’ve expanded the location filter options to include custom characteristics you’ve loaded, such as regional manager and lease renewal dates.

    Filter locations with custom fields

    Leverage updated shopping centers datasets

    Our shopping centers data layers just got a refresh – complete with new labels that match the ICSC classifications you know and love.

    Don’t worry, our legacy shopping centers data is still there, just consolidated into a single group. We think you’ll love the new data layers so much though that you won’t even miss it.

    Leverage updated shopping centers datasets

    Find out if a shopping center is a good fit and how to market to those shoppers

    SCOUT retail edition subscribers, rejoice! We’re making it easier than ever to find out if a shopping center attracts the right type of shoppers for your business. Our new Shopping Center Insights Report compares the center’s visitors to your Buxton customer profile so you can see the level of overlap and how to market to those shoppers.

    SCOUT essentials edition subscribers, talk to your Buxton representative if you are interested in upgrading to a package with this report.

    Find out if a shopping center is a good fit and how to market to those shoppers

    Leverage updated points of interest datasets

    Rest easy knowing that your SCOUT insights draw from the latest available information. SCOUT reports and data layers have now been formatted to reflect 2022 healthcare and hotel points of interest.

    Have more questions?

    Have more questions? Check out the Knowledge Base or contact your customer success manager. 

    Release Notes: March 30, 2023
    March 30, 2023

    Product Release Summary

    Buxton’s team has been working hard to enhance your platform experience and we are excited to share some new features with you!

    Check out these product updates.

    Leverage updated traffic count datasets 

    Rest easy knowing that your SCOUT insights draw from the latest available information. SCOUT points of interest traffic counts now reflect 2022 data.

    Add logos to pushpins to customize your maps

    Creating intuitive, custom maps for your stakeholders is easier than ever. You can now upload custom logos to existing SCOUT pushpins to make those locations pop. Save time giving your decision makers the maps they want to see.

    Add logos to pushpins to customize your maps

    Add context with observed volume metrics

    While mobile GPS data represents a sample set of overall visitors, sometimes it’s nice to know how many devices were observed. Mobilytics Advanced Reporting now includes observed device counts to add context to volume metrics.

    Add context with observed volume metrics

    Save time with new "select all" option

    Life is too short to click boxes one by one. You can now “Select All” competitors and cotenants in the Places filter when building an IQ Geographies query.

    Save time with new

    Have more questions?

    Have more questions? Check out the Knowledge Base or contact your customer success manager. You can also register for our retail or healthcare client training sessions in April to learn more about IQ Geographies queries!

    Release Notes: March 2, 2023
    March 2, 2023

    Product Release Summary

    Buxton’s team has been working hard to enhance your platform experience and we are excited to share some new features with you!

    Check out these product updates.

    It’s a big month for IQ! We’re excited to introduce a new query category: Geographies.

    Run queries on geographic areas

    Finding geographic areas that meet your desired criteria has never been easier. Whether you are looking for the perfect ZIP codes for targeted marketing or prioritizing a list of Buxton recommended trade areas for future growth, the IQ Geographies query category is your new best friend.

    The Geographies query builder allows you to study the following:

    • Standard U.S. geographies
    • Custom territories that you’ve previously loaded into SCOUT
    • Custom trade areas that you’ve previously loaded into SCOUT
    Run queries on geographic areas

    Enhance and share Geographies query results

    Just like the My Locations query category, you can add extra columns of data to your Geographies query results, push your findings to SCOUT to view them on a map, or export a report.

    Enhance and share Geographies query results

    Save time when appending competitor and cotenant data

    Tired of selecting competitors and cotenants one by one? We have a time saving hack for you! You can now “Select All” competitors and cotenants in the Places & Distance filter when adding columns of additional data to your IQ query results.

    Save time when appending competitor and cotenant data

    Have more questions?

    Have more questions? Check out the Knowledge Base or contact your customer success manager. You can also register for our retail or healthcare client training sessions in April to learn more about IQ Geographies queries!

    Release Notes: April 2022
    April 2022

    Product Release Summary

    Buxton’s team has been working hard to enhance your platform experience and we are excited to share some new features with you!

    Check out these product updates.

    Expanded hotel Points of Interest data

    Know more about existing hotels in the markets you are studying. View helpful information such as hotel type, chain name, number of rooms and more. Check out the info bubbles for hotel Points of Interest to view details on each property.

    Expanded hotel Points of Interest data

    GPS data update

    The GPS data that drives Mobilytics advanced reporting is now even more robust as Buxton expands its pool of GPS data providers. While estimated visitor volumes should remain the same, you will see even more visitor dots on the map thanks to higher counts of actual observed visitors.

    GPS data update

    Match is receiving the same data update as Mobilytics. The GPS data driving your Match analysis is now even more robust.

    Learn More

    Have more questions? Buxton clients can reference the Knowledge Base or reach out to their account manager/support rep. Not a Buxton client yet? Contact us to request a demo.

    Release Notes: March 2022
    March 2022

    Product Release Summary

    Buxton’s team has been working hard to enhance your platform experience and we are excited to share some new features with you!

    Check out these product updates.

    From new Points of Interest data to expanded user controls, we’re making the SCOUT application you love even better.

    Import more Areas of Interest data

    Want to display your own Areas of Interest data at a different geographic level than the current ZIP code option? You can now import data at the block group level for granular insights or county level for bigger picture trends.

    Import more Areas of Interest data

    Control pushpin labeling

    Customize map labels for pushpins to tell your story better. You can now decide whether to display pushpin names, pushpin addresses, both fields, or neither field on the SCOUT map through simple checkboxes in the Active Items section.

    Control pushpin labeling

    Access more insights on school locations

    Need to dive deeper into school location data? Our Points of Interest data for schools has expanded significantly. Select from 20 layers that cover different grade groupings and school types (public, private, and charter).

    See Mobilytics insights at a glance

    When you integrate Mobilytics into SCOUT, you’ll now see more details from your Mobilytics Advanced Reporting analysis in SCOUT’s Mobilytics Places info window. See the following insights without having to open your Mobilytics report: 

    • Estimated last twelve months visits
    • Estimated last twelve months visitors
    • Brand rank
    See Mobilytics insights at a glance

    Find the thematics you need

    We’ve improved thematics labeling. The thematic group titled “Ethnicity” is now titled “Race/Ethnicity” and race/ethnicity thematic names have been standardized across Buxton Platform applications.

    Learn More

    Have more questions? Buxton clients can reference the Knowledge Base or reach out to their account manager/support rep. Not a Buxton client yet? Contact us to request a demo.

    Release Notes: Healthcare Automated Site Score Model Updates
    Healthcare Automated Site Score Model Updates

    Product Release Summary

    The Buxton team is committed to bringing you the best analytical tools on the market. Our healthcare automated site score models have been updated and will be made available beginning in March 2022.

    Learn more about the updates and what to expect.

    Big picture: what changed?

    While the user interface and outputs look largely the same as previous versions of our healthcare automated site score models, Buxton updated both the underlying data and the methodology that drives the models. 

    These updates have a significant, positive impact on location site scores and are designed to make the models even more useful.

    What data sources changed?

    Buxton updated the healthcare location data used in these models to our most recent dataset. This data is used both for the sample set in the model and for competition and area draw variable measures.

    How did the methodology change?

    Buxton implemented a new methodology for selecting the sample set of locations used for benchmark comparisons. As always, the user can override the default selections by selecting a custom sample set.

    In short, the original methodology focused on the nearest relevant locations. For service lines where specialty offices tend to cluster together, the model would often pull sample locations within a very small geographic area, which meant there was little to no variation for score calibration. Additionally, sample sets were highly customized for each location, which meant that scores could not be compared across sites.

    The updated methodology made two major adjustments:

    • Sample sets for each model are pre-determined for consistently comparable results. 
    • Sample sets are determined at least at the market level (DMA), so locations scored with the same model in the same market can always be compared directly.

    Are model run times the same?

    The updated models pull in a larger default sample set of up to 50 locations for benchmarking than they did previously. For that reason, the models will take longer to run for service lines that have large facility counts. 

    Primary care, internal medicine, family medicine, and physical therapy are the most likely to experience longer run times. However, the payoff for the longer run time is a more confident answer.

    Are there any changes to how users interact with the models in SCOUT?

    No, you will interact with the models the same way as before. 

    In SCOUT, right click on the potential location and select the option to score that site with the automated models. You can select your own benchmark locations, as before, or use the default locations selected by the model.

    How have the outputs changed with this model update?

    In the previous version of the automated site score models, the score sheet included a “comparable locations” section when the user selected their own benchmark locations. This section, pictured below, has now been removed.

    How have the outputs changed with this model update?

    Learn More

    Have more questions? Check out our healthcare automated site score model documentation in the Buxton Platform Knowledge Base or reach out to your account manager/support rep. 

    Release Notes: February 2022
    February 2022

    Product Release Summary

    Buxton’s team has been working hard to enhance your platform experience and we are excited to share some new features with you!

    Check out these product updates.

    We’ve polished the sharing features for the Mobilytics dashboard page, made updates to the mobile version of the application, and expanded visit volume trend visualization options.

    Share dashboard results with confidence

    When you share your selected Mobilytics dashboard view through a digital share link, you now have more control over what the recipient will see. As Mobilytics evolves, you can be confident that your previously generated share links will continue to look as you intended even if the application features have changed. Dashboard share links will now preserve their original formatting.

    Know which version to use: mobile or desktop

    We are committed to giving you an outstanding user experience. Because the mobile version of Mobilytics isn’t processing share links, report exports, and component-level exports as well as you deserve, we’ve made the decision to remove this feature from mobile for a time.

    Use the mobile version for on-the-go insights but turn to the full desktop experience for sharing features that are a breeze to use. Look for a return of mobile sharing features once the user experience has been perfected.

    Know which version to use: mobile or desktop

    Select new visits volume trend views

    From the existing line graphs and tables to new bar charts and stacked bar charts, select the view that helps you best communicate a property’s dynamics.

    Select new visits volume trend views

    Browse segments faster

    Browse consumer segments in SCOUT faster than ever with enhanced labeling. Each major consumer group will now include the group name in addition to the group category letter.

    Browse segments faster

    Learn More

    Have more questions? Buxton clients can reference the Knowledge Base or reach out to their account manager/support rep. Not a Buxton client yet? Contact us to request a demo.