Discover which retail, restaurant or consumer service brands are the best match for any site nationally. Use aggregated consumer behavioral data to compare visitors at the brand's current locations to your site's trade area. Present a compelling case to prospective tenants with data-driven insights.
Compare and present the most important metrics brands use in site selection
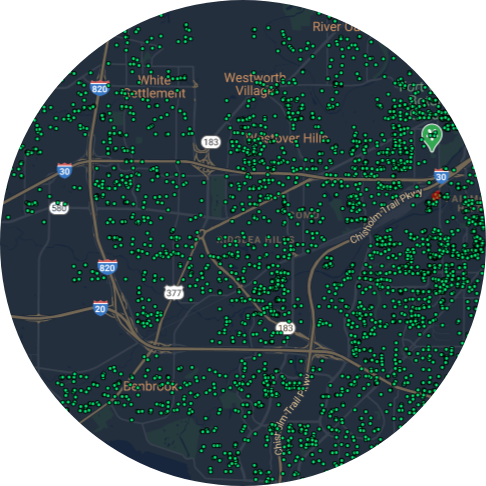
Trade Area
See the true trade area of any location using data from actual visitors
Dynamic Sales
Open doors with data using easy to share interactive reports
Overview
Easy-to-use analytics
Use analytics derived from consumer behavioral data combined with psychographic segmentation to match brands with properties.
Massive Scale
Built to scale with Buxton’s robust data library
Historical Data
Covers back to January 1, 2019
Clean & Accurate
Proprietary data cleansing and normalization methods
Buxton Enriched
Advanced attributes for making assessments
Match brings your leasing and development processes from offline to online
Buxton’s Match application allows you to compare a new location to a brand's existing locations based on customer potential and current customer observations. Users leverage these insights to make informed decisions about the feasibility of a brand at any given location, or to identify which brands within a retail category are the best match. Guide development decisions with Match.
How it Works
Compare actual observed visits at any site to visits at a brand's locations
Use Buxton’s aggregated, deidentified consumer behavior insights to analyze traffic at selected places and times.
Pick any retail location or site to analyze
Select a time range for comparison
Select up to five targeted brands or a category to study
Select desired square footage range
Compare brands by proximity or geography
Simple and Powerful
Easily identify matches with key metrics
Interactive results are presented as benchmark index numbers that are easy enough for anyone to understand. Quickly visualize and compare the key metrics brands are looking at. Red is poor. Yellow is average. Green means great. It's that easy.
POOR
AVERAGE
GREAT
100
Ideal Customer Count
How do counts of ideal households in the trade areas compare?
200
Index
0
100
200
Ideal Customer Ratio
How does the ratio of ideal households to all households in the trade areas compare?
185
Index
0
100
200
Ideal Customer Similarity
How similar is the mix of all households in the trade areas?
123
Index
0
100
200
Psychographic Profile
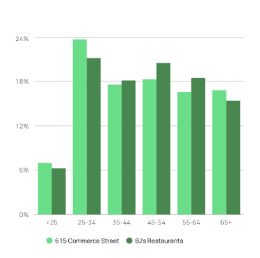
Compare lifestyle and behavior attributes
Demographics don't cut it. View the psychographic make-up of the households in your site's trade area next to the brand's sites. Compare the primary, secondary, and non-core households. View detailed customer profiles of ideal visitors.
Lifestyle and behavior attributes
Side-by-side comparison
Detailed customer profiles
Ideal visitor segments
Household Composition
Prove your site is a match for the brand with data
Compare the potential customer similarity of your site to the brand's sites using household composition, economic circumstances, and housing and living metrics.
Household Composition
Marriage
Presence of Children
Number of Persons
Head of Household Age
Race and Ethnicity
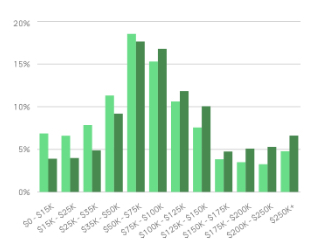
Economic Circumstances
Household Income Levels
Household Education Levels
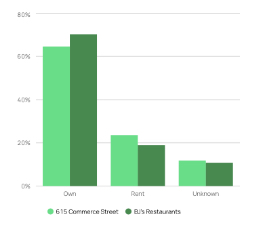
Housing & Living
Dwelling Type
Own vs. Rent
Length of Residence
How You Execute with Smart Data
Add site details and share an interactive report
Add and edit your site's details by uploading photos, site plans, maps, and more. Quickly share the same interactive report you use via link, email, LinkedIn, or Twitter, or export summaries to print, share, or upload to real estate listings.
Preview
Email
LinkedIn
Twitter
Let's chat.
We want to make it easy for you. We’re here to answer your questions about how we can work together to help your organization reach its goals.
We care about consumer privacy. All visitor home and work locations are geographically shifted to a small degree and we won’t return results if the aggregated data reflects less than 50 unique visitors observed in your selected study area.