
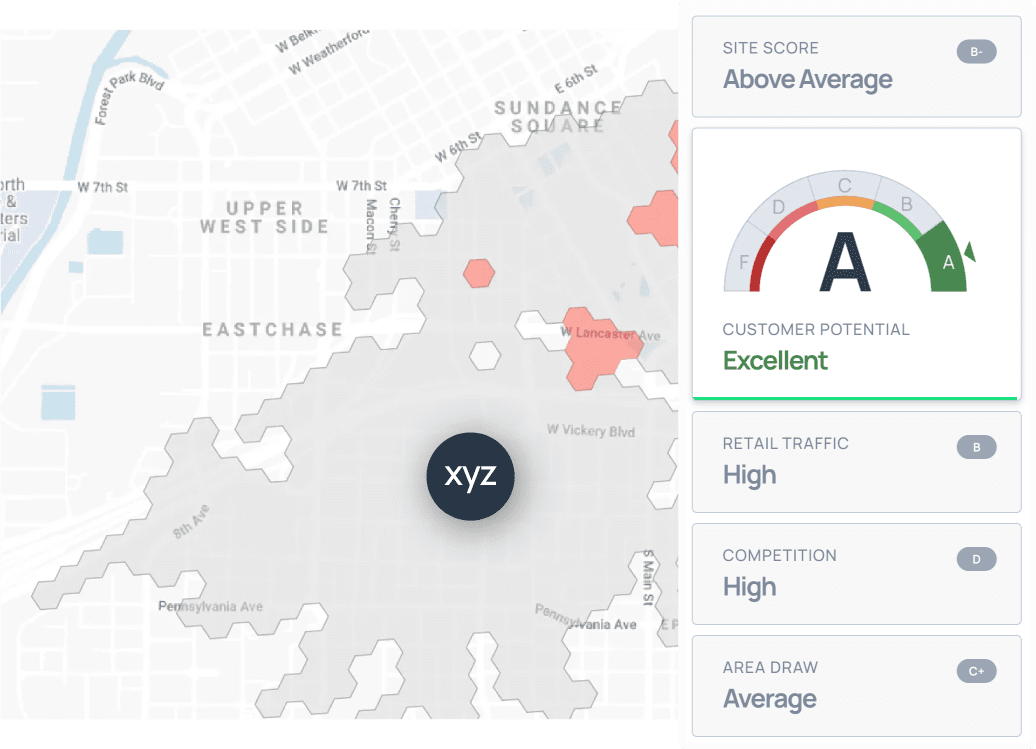
Site Scoring
Compare retail sites to generate instant, easy-to-understand scorecards.
- View grades for the most common factors that indicate performance potential: overall assessment, customer potential, retail traffic, competition, and area draw
- Access additional metrics not factored into the scorecard that can inform on the opportunity
- Generate scorecards using multiple models simultaneously to assess which brand is best for a site
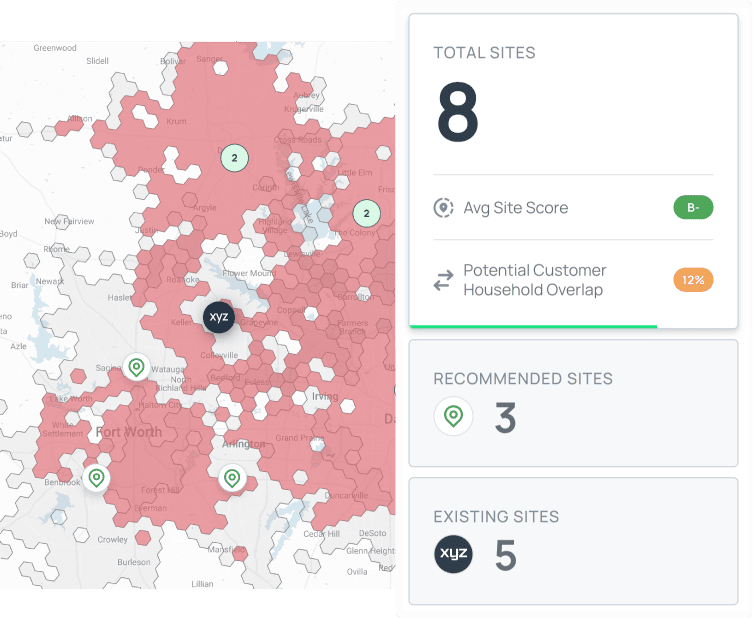
Market Optimization
Identify a brand’s location growth potential within a DMA or custom territory.
- Control the customer overlap and site score thresholds used in the analysis
- View the total number of possible sites, the total number of recommended new sites, and the number of current sites
- Visualize the geographic trade areas for recommended new sites
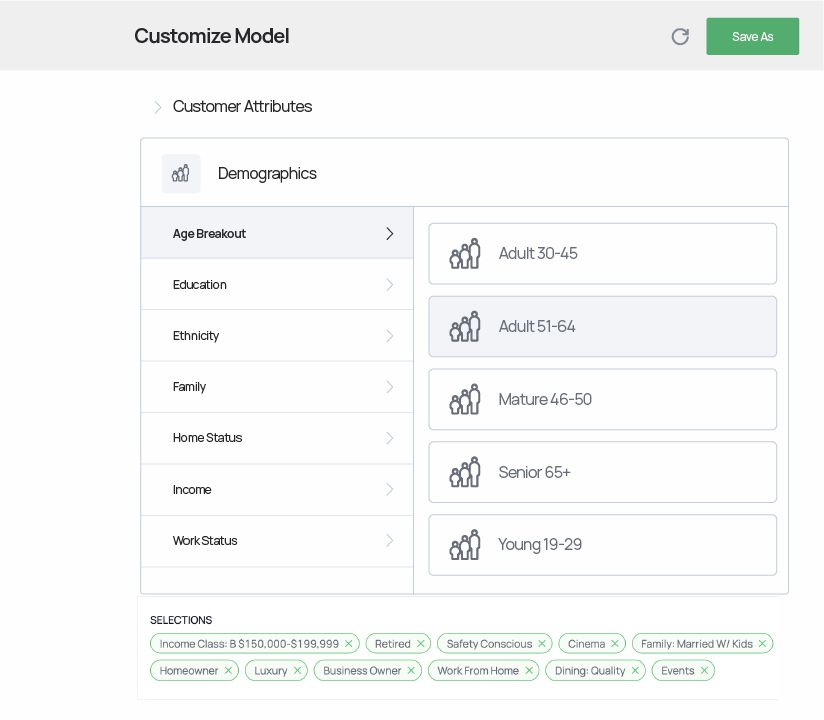
Factor Customization
Customize your site scoring experience.
- Access Buxton’s full library of automated site score models
- Customize a model by adjusting variables, variable weights, and comparable site benchmark sets
- If desired, integrate with Buxton’s SCOUT application to initiate site scores from a single application