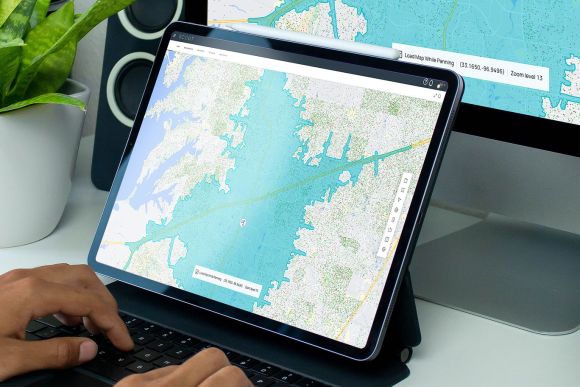
In today's dynamic healthcare landscape, strategic planning is paramount. To keep pace with this rapidly evolving environment, health systems are turning to tools that can distill complex data into understandable and actionable insights. One such tool making a significant impact is map visualization. At Buxton, we've seen firsthand how these geographical representations can go beyond just showing "where" to telling a powerful story that can guide strategic decision-making.
During a recent webinar titled "How UMiami Health System Creates Custom Map Visualizations to Support Strategic Planning," Blaine Dinkin, Strategy Associate at the University of Miami Health System, shed light on the transformative role of map visuals in healthcare.
According to Dinkin, "Everyone has their own reasons why they're using mapping. In healthcare, it really tells a story of where things are, where patients are, and where locations are relative to those patients.” As health systems gain access to more data on future population trends and medical procedure volumes, these visual tools become invaluable in planning and supporting departments and partners.
This is where Buxton's SCOUT, a web-based geospatial application, comes into play. It provides health systems with a platform to visualize location and patient data, along with other market insights. Dinkin noted the value of custom thematics in SCOUT, which have been instrumental in sparking conversations with different internal departments. As she said, "Our biggest component in what we use is the custom thematics, using custom areas."
Dinkin also highlighted how map visuals can help meet specific department needs. For instance, when the oncology department needed data for certain procedures and appointment types, they turned to SCOUT visualization. "We have actual patient data redacted, non-identified. So we have great data to say these are where our patients are coming from. What we then do is map it onto Buxton using the custom thematics, which really helps us understand concentration of growth." This approach aids health systems in meeting community needs and becoming a preferred choice for patients.
But the benefits of map visuals don't stop there. Dinkin emphasized how these tools can drive strategic conversations and help navigate the ever-changing market. "It really begins to start the conversation because a lot of times the department chairs the leadership. This opens their eyes and they start to have other questions, which is where we can come in and provide our expertise and thoughts and build more maps if we need to, to really help them grow and stay afloat in this ever-changing market."
In conclusion, map visuals, powered by tools like Buxton's SCOUT, are a cornerstone of strategic planning in the healthcare industry. As Dinkin's insights from the University of Miami Health System illustrate, these tools can provide the necessary guidance for health organizations to adapt, innovate, and excel in an ever-evolving market. As we move forward, we're excited to see how more health systems leverage these visualization tools to transform their strategic planning processes.


