
The world shifted in 2020. Businesses around the world shut down, and more people than ever began working remotely. And with the vast majority of restaurants closed, most people had no choice but to cook and eat at home—meaning they had to buy groceries.
Now faced with more flexible working hours and fewer dining options, the question is: What impact did the pandemic have on the day of the week that people grocery shopped, and the number of trips that people took? And more importantly, are those trends still holding true today? Understanding these answers is important for grocers because changes in these metrics can impact staffing needs, marketing efforts, and more.
To investigate, we turned to Buxton’s Consumer Impact Dashboard. The dashboard uses GPS data from mobile devices to track trends in visitor volume by business category—in this case, grocery stores. With the help of this tool, we compared before the pandemic in April 2019, during the pandemic in April 2020, and after the pandemic in April 2021 in all 50 states and Washington D.C.
Here’s what we found.
Relative Volume
Let’s start by looking at the relative volume of grocery store shoppers by the day of the week. According to device activity, the least popular day of the week to shop before the pandemic was Tuesday, with only 13.43% of all grocery trips occurring, while the most popular day was Saturday, with 16.43% of all grocery runs happening.
While Saturday held the top spot for all three periods evaluated, the least popular day fluctuated. Before the pandemic, it was Tuesday, and at the tail-end of the pandemic in April 2021, it was Wednesday. But in the midst of the April 2020 lockdowns, the least popular day to grocery shop was Sunday, when only 12.87% of all trips happened, compared to 13.86% of all trips on Sunday in 2019 and 14.68% in 2021. Even the middle weekdays—Tuesday and Wednesday—had more device activity than Sunday.
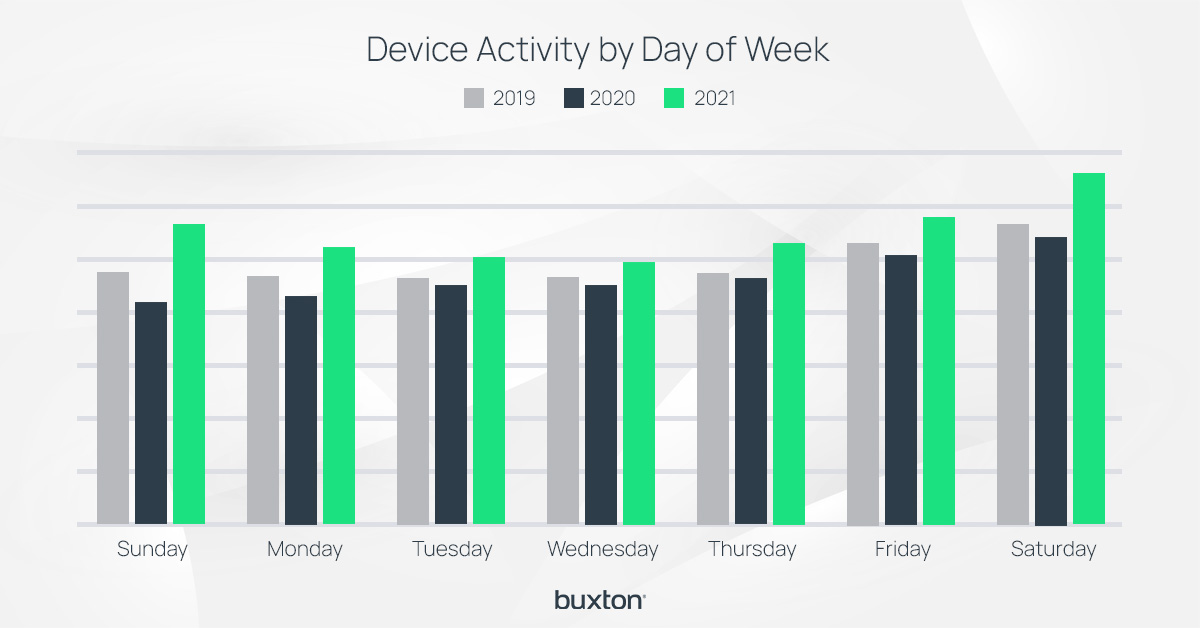
Overall, April 2020 had lower volume trends than 2019, with 5.4% fewer trips happening. This may seem surprising, considering that grocery sales were 13% higher than they were in April 2019, according to Supermarket News. But because consumers were encouraged to consolidate their trips for essential goods and services, people were making fewer trips and increasing their basket sizes.
Additionally, many stores had strict restrictions on the number of people who could enter a store, when, and how long they could stay, which may have encouraged consumers to switch their shopping day. It’s also possible that working from home created more flexibility for people to shop on other days and at other times, allowing them to avoid grocery stores at their busiest hours. This could play a role in the drop in Sunday visit volume.
In contrast, visitor foot traffic increased dramatically across the board in April 2021. Volume went up 18.7% over 2020 and 12.3% over 2019. In other words, no matter which day of the week you look at, the number of trips increased, and grocery stores are benefitting tremendously even as restrictions lift and consumers can once again visit restaurants.
States Most Likely to Grocery Shop on Weekdays
Across the U.S., the majority of grocery visits happen on weekdays, but some states have a higher volume of weekday visits than others. In April 2021, the following states had the residents who were most likely to grocery shop on a weekday, as opposed to a weekend (Saturday or Sunday). Of these ten states, seven were also in the 2019 top ten list, and four were in the 2020 list. This consistency with the pre-pandemic top ten suggests a return to normalcy.
1. Alabama
Alabama took first place, with 70.8% of its residents choosing to shop on a weekday. Though this was one of the states at the top of the 2019 list, this percentage is actually less than it was in both 2019 and 2020. This overall decrease shows that, as a whole, fewer people are buying groceries on weekdays.
2. West Virginia
3. Florida
4. Iowa
5. Hawaii
6. Mississippi
7. Vermont
8. South Carolina
9. Arkansas
10. Maine
States Least Likely to Grocery Shop on Weekdays
Conversely, in April 2021, residents in the following states were the least likely to visit grocery stores on weekdays and were more likely to visit on a weekend. Of these ten states, six also appeared in each the 2019 list and the 2020 list, showing the weekend shoppers have remained slightly more consistent throughout the pandemic.
1. Massachusetts
The residents of Massachusetts were the least likely to grocery shop on a weekday, with only 65.8% doing so. What’s interesting about this is that Massachusetts appeared on neither the 2019 nor the 2020 list of the top ten states least likely to buy groceries during the week. This suggests a change in behavior.
2. Rhode Island
3. New Jersey
4. Delaware
5. Kansas
6. Maryland
7. Connecticut
8. Illinois
9. Ohio
10. New Hampshire
The Bottom Line
While working from home has not permanently changed when people grocery shop, it did temporarily shift things. The data shows that grocery shopping visit days have started to swing back toward their pre-pandemic trends—a sign that things are returning to normal. The growth in grocery visit volumes over the pre-pandemic levels—even as restaurants have started to reopen—is an encouraging sign for the industry. As restrictions continue lifting and restaurants open more consistently across the country, it will be interesting to see if the 2021 high-volume grocery store foot traffic trends continue to hold.
To learn more about how Buxton can uncover insights like this and more for your organization, check out our retail platform.

