Meet Your Customer Insights Alert 2.0
Alert is a monthly business intelligence report produced by Buxton, the global leader in retail customer analytics. It delivers relevant insights and recommendations straight to your inbox so you can make smart decisions.
Learn how to interpret your Customer Insights Alert 2.0 so you can arm your team with an action plan for success.
Fast Facts
Time Period
Each alert reflects the most recent complete month of data. Most sections of the alert compare datasets month over month. Exceptions are noted in How to Interpret Your Alert.
Data Sources
Alert pulls exclusively from Buxton’s data sources. This includes aggregated consumer behavioral data, Mosaic consumer segmentation data, brand and shopping center location data, U.S. Census Retail and Services sales data, and aggregated user activity data in the Buxton Platform.
Customers
A customer is defined as an observed visitor.
Locations Included in the Analysis
Buxton includes locations that we can track. Some locations may be excluded due to insufficient sample sets of data for analysis or a lag in adding new locations to our database.
Data Update Frequency
Consumer behavioral data calculations are updated every month. Location data is updated approximately once per month, but it may take a few months for new locations to appear in our database for tracking.
How to Interpret Your Alert
Cover Page: Top Three Locations Winning or Losing
The cover page of your PDF report summarizes the top three locations where you are either consistently winning or losing versus nearby competitors based on changes in foot traffic.
Alert will default to the top three locations consistently losing. If there is not a meaningful trend of consistently losing locations, then the top three locations consistently winning will be shown instead.
Elements on this page include the following:
- A color-coded summary of the location’s performance group for up to the last six months. For details on the performance groups, please see the “Where You Are Winning and Losing: Performance Groups” section of this guide.
- The top competitor in the location trade area that is consistently winning foot traffic from consumers who match your brand’s customer profile.
- The top Mosaic segment from your customer profile that is consistently trending down in visits (or trending up in the case of a winning location).

Brand Performance Score
The brand performance score provides a summary of how well your company is doing relative to competitors based on share of visits. The score is based on a three-month rolling average and reflects two inputs:
- The distribution of your locations across six performance groups, which are described in detail in the next section
- How your performance distribution compares to the rest of your industry’s performance distributions
Your brand performance score is also presented as a trend graph for the last six months. Aggregated scores for your industry are provided for competitive context.
Where You Are Winning and Losing: Performance Groups

We break down the brand locations we can track into six groups: three groups where you are winning relative to nearby competitor locations, and three groups where you are losing relative to nearby competitor locations. The definition of each group is listed in the Foot Traffic Trend box immediately below it. For example, locations in the group labeled “Crushing It” saw an increase in foot traffic while nearby competitor foot traffic decreased. The arrows next to the total number of locations in each group indicate how many locations were added or subtracted from that group during the prior month.
If a location is listed as too close to call, that means that either 1) we didn’t have enough data for that location or its competitors to calculate the metrics, or 2) the location finished in a near tie against its competitors.
Buxton uses proprietary methodologies to clean observed visitor data, measure foot traffic, and control fluctuations attributed to reasons other than true visit volume changes.
Where You Are Winning and Losing: Additional Insights
As you move vertically down each performance column, Alert shares additional insights into what’s happening with each group of locations.

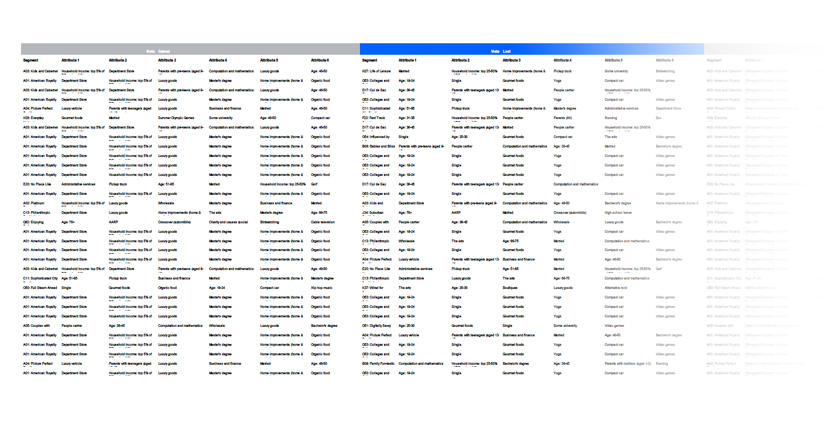
Customer Trends: Gains and Losses
Alert shares insights into the types of customers you are gaining at your winning locations and the types of customers you are losing at your losing locations. This insight is based on the Mosaic segments associated with aggregated visitors observed at your locations. Within your brand’s top segments network wide, we identify the three segments with the biggest increase or decrease for that specific performance group, quarter over quarter, on a rolling basis.
The attributes listed are both highly represented in your three most changed segments for the locations in that performance group and above average when compared to the population.

Commercial Expansion Rating
The commercial expansion rating measures how active the market is around the locations in each performance group. Activity is measured based on aggregated user activity data in the Buxton Platform (e.g. site scores and other activity that indicates interest) and observed location openings. The zone measured around each location is roughly the size of a two-mile ring. A 5/5 expansion rating indicates that the locations are approximately in the top 10% of zones within their DMA.

Top Competitor
The top competitor for each performance group is based on a weighted average of the brands that are observed as top competitors for the locations within that group. Alert notates whether the impact of that competitor is growing or declining for your entire brand (not just for that performance category).
Top 10 Winning Locations
This section highlights 10 locations from the three winning performance groups and provides location level – rather than group level – insights into their performance. These 10 locations reflect those winning by the widest margin. The Winning By percentage reflects the difference between the change in traffic ranking for your locations and the average change in traffic ranking for nearby competitor locations.

For each location listed, read the recommendations vertically rather than horizontally. The three target attributes apply to all three recommended ZIP codes, for example.
- Brand affinities reflect the banners where these customer segments show up at a higher frequency than the population average for that DMA.
- Recommended ZIP codes are nearby ZIP codes with the highest concentrations of the three target segments.
- Recommended outreach channels reflect the marketing channels that index the highest across your three target segments.
If we do not have enough data to generate marketing recommendations for a location in the accompanying Excel file, then the recommendations default to your network-wide averages.
Top 10 Losing Locations
This section highlights 10 locations from the three losing performance groups and provides location level – rather than group level – insights into their performance. These 10 locations reflect those losing by the widest margin. The Losing By percentage reflects the difference between the change in traffic ranking for your locations and the average change in traffic ranking for nearby competitor locations.

The target customers listed here reflect the customer groups that saw the most significant loss at each location.
All other insights are calculated the same way as the metrics shown on the top 10 winning locations list.
Actionable Insights for Losing Locations
Alert provides marketing recommendations to get your losing locations back on track. The recommendations are based on the three customer segments within your top segments that saw the greatest decrease at each location.

For each location listed, read the recommendations vertically rather than horizontally. The three target attributes apply to all three recommended ZIP codes, for example.
All other recommendations are calculated the same way as the metrics shown on the actionable insights for winning locations.

Performance Outlook
This section includes a performance outlook for both your brand and your industry over the next three months. It is derived from machine learning time series models that reference U.S. Census Retail and Services sales figures. The brand outlook also considers trends in your foot traffic, including differences in customer segment behavior relative to the rest of your industry, to refine the projections. Each outlook measures your risk of sales decline.
- A Positive forecast means you have a low risk of sales decline compared to the same period last year.
- A Negative forecast means you have a high risk of sales decline compared to the same period last year.
Bonus Insights in Excel and .CSV Files
Regional Recommendations
In addition to providing customer and competitor insights at the location level, Alert provides aggregated insights and recommendations for four geographic regions:
- Overall (network wide averages)
- Region (U.S. Census Divisions)
- State
- DMA
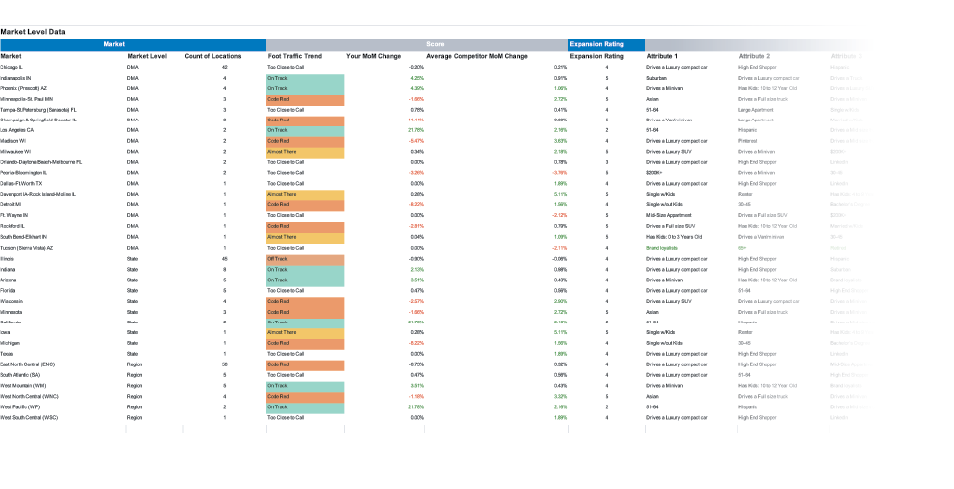
The regional recommendations are available in the Excel file component of each monthly Alert report. Simply navigate to the tab labeled “Markets.”
The metrics included in the regional recommendations are the same as those included for individual locations, but they are aggregated for a group of locations. Specific ZIP codes with high concentrations of consumers matching your customer profile are excluded from the regional recommendations, since these insights are intended to fuel broader campaigns.
Google and Meta Ad Audience Recommendations
In addition to providing customer profile definitions for the consumers your business is gaining and losing, Alert also provides recommended audience filters to reach those consumers via Google Ads and Meta campaigns.
We mapped audience filters in Google Ads and Meta to the Mosaic segments used to define your customer segments in Alert. We provide six recommended filters per channel for the top Mosaic segment you gained and six recommended filters per channel for the top Mosaic segment that you lost during the previous month.
This information is available at the location level and region level in the Excel file and the location level in the .CSV file.
Other Frequently Asked Questions
How is the competitor set defined?
Competitors are selected for your Alert based on industry tags in the Buxton database. These tags are intended to capture both industry categories and similarities in customer base. For example, a Tex-Mex restaurant may not traditionally view an Italian restaurant as a competitor, but if the two brands are both casual dining chains that target similar customers then they could be classified as competitors in Alert.
Can we modify the competitor set?
Yes, the following customization options are available upon request:
- Removing a competitor from your current competitor list
- Prioritizing specific brands that are already being tracked
- Modifying your primary or secondary business category in our system
To request a modification, please email alert@buxtonco.com.
Why aren’t all of my locations listed?
Buxton includes locations that we can track. Some locations may be excluded due to insufficient sample sets of visitor data for analysis or a lag in adding new locations to our database.
I noticed a closed location on the list. Why would a closed location appear?
There can be a lag in Buxton being notified of closed locations, which means they will continue to show up in our database until our next data update. If you spot a closed location that should not be appearing, please contact alert@buxtonco.com. Requests for removal received prior to the 15th day of each month will be reflected in the report provided that month; requests received after the 15th day of each month will be reflected in the following month’s report.
This does not correlate with my performance. How do I think about it in that context?
Foot traffic does not perfectly correlate with sales performance, particularly in sub-industries where browsing is common. For that reason, you should not expect the rankings to perfectly reflect your sales reports.
Even more importantly, Alert bases its performance groups on change in foot traffic relative to change in foot traffic at nearby competitor locations. A location that might be middle of the pack in terms of sales performance could rank highly if it consistently beats nearby competitors based on foot traffic. Alert should be interpreted as a view into your relative foot traffic performance versus competitors.