Meet Your Customer Insights Alert
Alert is a monthly business intelligence report produced by Buxton, the global leader in retail customer analytics. It delivers relevant insights and recommendations straight to your inbox so you can make smart decisions.
Learn how to interpret your Customer Insights Alert so you can arm your team with an action plan for success.
Fast Facts
Time Period
Each alert reflects the most recent complete month of data. For example, the alert you receive in January will reflect what happened in December. Most sections of the alert compare datasets month over month. Exceptions are noted in How to Interpret Your Alert.
Data Sources
Alert pulls exclusively from Buxton’s data sources. This includes aggregated consumer behavioral data, Mosaic consumer segmentation data, brand and shopping center location data, U.S. Census Retail and Services sales data, and aggregated user activity data in the Buxton Platform.
Data Update Frequency
Consumer behavioral data calculations are updated every month. Brand and shopping center location data is updated approximately once per month, but it may take a few months for new locations to appear in our database for tracking.
How to Interpret Your Alert
Customers and Locations Tracked

This section tells you how many consumers Buxton observed for this month’s analysis. It includes both your customers and your competitors’ customers. A customer is defined as an observed visitor.
The location count listed here reflects how many of your brand’s locations we were able to track. Some locations may be excluded due to insufficient sample sets of data for analysis or a lag in adding new locations to our database. Additionally, the location count throughout different sections of the alert may vary depending on whether each location had sufficient data for the specific analysis.
Your Location Foot Traffic Trends

This graph compares the month-over-month foot traffic change for each of your locations to the average month-over-month foot traffic change for nearby competitor locations. Buxton uses proprietary methodologies to clean observed visitor data, measure foot traffic, and control fluctuations attributed to reasons other than true visit volume changes.
Your Customers
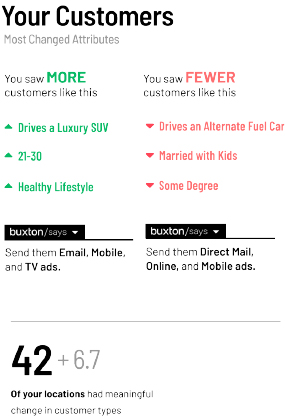
Most Changed Attributes
To calculate changes in customer attributes, Buxton evaluates the Mosaic segments associated with aggregated visitors observed at your locations. Within your top segments, we identify the three segments with the biggest increase or decrease quarter over quarter on a rolling basis. The attributes listed are both highly represented in your three most changed segments and above average when compared to the population as a whole.
Marketing Channel Preferences
Buxton recommends the marketing channels that index the highest across your three most changed segments.
Locations with Meaningful Changes
To determine which locations experienced a meaningful change in customers, we look at the absolute change in observed visit volumes on a rolling quarter-over-quarter basis for your top segments. If we observe an average change of 2.5% across the top segments at a location, then that location is flagged. If less than 10% of your network is flagged, then we count the top 10% of your network that experienced any change.
Your Competition
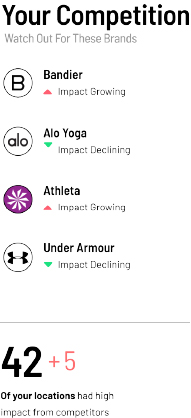
Brands to Watch
This section highlights the top four brands that are observed to have a negative impact on your locations by drawing customers that match your customer profile from your trade areas into their locations. Both direct and indirect competitors are considered. We calculate competitive impact at the location level and then roll it up to the brand level. Competitive impact scores are weighted averages of several variables that indicate the intensity and frequency of a brand’s negative impact on your locations.
Locations with High Competitor Impact
This section tallies how many of your locations experience high competitive impact based on two measurements: the percentage of customers stolen by nearby competitors and the intensity of nearby competitors. Stolen customers are defined as consumers who match your customer profile and live in one of your trade areas but visited a competitor location. The metric is weighted based on how similar the competitor is to your brand. Competitive intensity accounts for both the volume and proximity of competitors in the area.
Your Active Markets
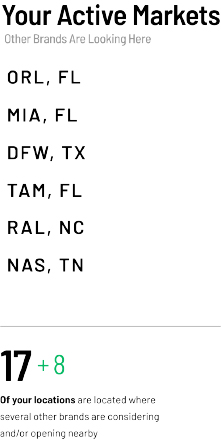
Active Markets List
This section highlights DMAs where your brand currently operates that are attracting more interest from other organizations than is typical for similar sized markets and population densities. Interest is measured by aggregated user data in the Buxton Platform (e.g. site scores and other activity that indicates interest) and observed new location openings.
Locations in Active Markets
This section counts locations that are in a hot zone within its market, regardless of whether the market as a whole is considered unusually active. Hot zones are measured based on Buxton Platform user activity and observed retail location openings. Each hot zone is roughly the size of a two-mile ring.
Top 10 Locations That Need Your Attention
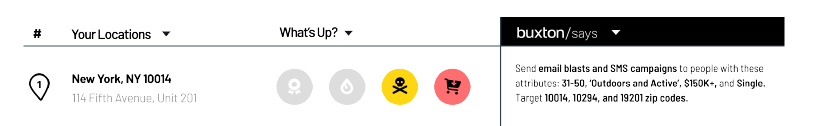
Alert Flags
In this section, Buxton highlights your top 10 locations that we flagged after analyzing four different alert scenarios:

Customers Changing – To receive this flag, a location needs to have seen either a minimum 2.5% change in visits from your top customer segments or be flagged as one of your top 10% of locations experiencing customer changes.

Hot Zones – To receive this flag, a location needs to be in a hot zone within its market, regardless of whether the market as a whole is considered unusually active. Hot zones are measured based on Buxton Platform user activity and observed retail location openings.

Competition – To receive this flag, a location must be defined as facing high competitive impact based on two measurements: the percentage of customers stolen by nearby competitors and the intensity of nearby competitors.

Underperforming – To receive this flag, a location must be in the “You Are Losing” quadrant of the foot traffic analysis highlighted previously.
Which Locations Make the List
Because not all locations have the necessary data to run each of the four alert scenarios, Buxton uses a series of rules to decide which locations are in the top 10. We sort based on the following:
- Count of positive flags
- Percent of positive flags
- A combined rank of the severity of each flag (not published)
Buxton summarizes how many of your locations in total received each alert flag and provides the list of flags for all locations in the accompanying CSV file.
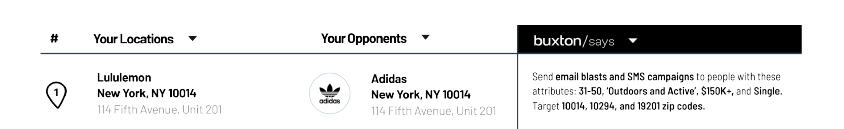
Location Marketing Plans
Marketing recommendations for each location are based on the three customer segments within your top segments that saw the greatest change, the attributes associated with those segments, and the nearby ZIP codes with the highest concentrations of those three segments. Because the change in customer attributes could be either positive or negative, marketing to these consumers will either help to continue the momentum or stop the leakage.
If we do not have enough data to generate a marketing plan for a location, then the marketing plan listed defaults to your network-wide averages.
Top 10 Competitive Battles
In this section, we zero in on your top 10 locations facing the stiffest competition from a single, specific competitor location. Once again, competitive impact is defined as stolen customers – consumers who match your customer profile and live in one of your trade areas but visit a competitor instead.
The marketing recommendations are based on the three customer segments within your top segments that saw the greatest decline at your listed locations. An assumption of this analysis is that if a location lost a specific customer type, then that customer went to the competitor.
Top 10 Locations Winning Market Share
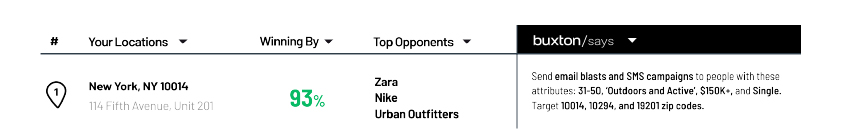
This section highlights 10 locations from the “You Are Winning” quadrant of the foot traffic analysis. These locations reflect those winning by the widest margin. The Winning By percentage reflects the difference between the change in traffic ranking for your locations and the average change in traffic ranking for nearby competitor locations. The brand names of nearby competitors with the biggest impact on the specified location are listed for reference.
The marketing recommendations are based on the three customer segments within your top segments that saw the greatest increase at your listed locations. An assumption of this analysis is that if a location gained a specific customer type, then that customer came to you from a competitor. Marketing to these customers can help you to continue the positive momentum.
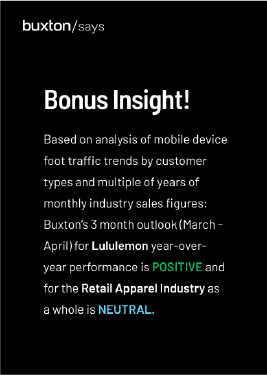
Bonus Insight: Performance Outlook
This section includes a performance outlook for both your brand and your industry over the next three months. It is derived from machine learning time series models that reference U.S. Census Retail and Services sales figures. The brand outlook also considers trends in your foot traffic, including differences in customer segment behavior relative to the rest of your industry, to refine the projections. Each outlook measures your risk of sales decline.
- A Positive forecast means you have a low risk of sales decline compared to the same period last year.
- A Negative forecast means you have a high risk of sales decline compared to the same period last year.